Users Ratings Re-weighted: Putting Trust Into Statistics
Would you trust statistics over your friend’s opinion?
 Solution here!
Introduction
…
Contents
- Preface
- Problem of Consumers’ Subjectivity
- How did I approach the problem
- Showing off My Solution
- Am I Sure of My Math?
Problem of Consumers’ Subjectivity
Consumers ratings are usually not based on objective metrics. Rather, They represent a personal subjective user experience such as dis-likeness of interface or aesthetic design. Could such subjective data be utilized for a rigor analysis of consumers behavior? Could we understand why consumers behave in some manner in response to some event/situation? The problem illustrated here is specially devoted to ratings of games made by the community of gamers.
How did I approach the problem?
We hypothesize a representative rating as follows: (I) A game with both great technical specifications and fun gameplay deserves highest rating, (II) A game with both low technical specifications and fun gameplay deserves lowest rating, (III) A game with great technical specifications and poor gameplay deserves low rating slightly greater than case (II), (IV) A game with low technical specifications and great gameplay deserves high rating slightly lower than case(I). The hypothesis is based on observations such as: (I) Minecraft, Even-though its graphics is extremely primitive, It is excessively praised by the community of gamers. The game is one of the most successfull entertainment franchises. (II) Anthem, Even-though its graphics is fascinating, It was excessively disappointing for the community. EA’s comment on the game is the most hated comment in reddit history. Generally speaking, It is perceived that great gameplay dominates poor technicalities, While great technical specifications do not forgive poor gameplay.
Showing off My Solution
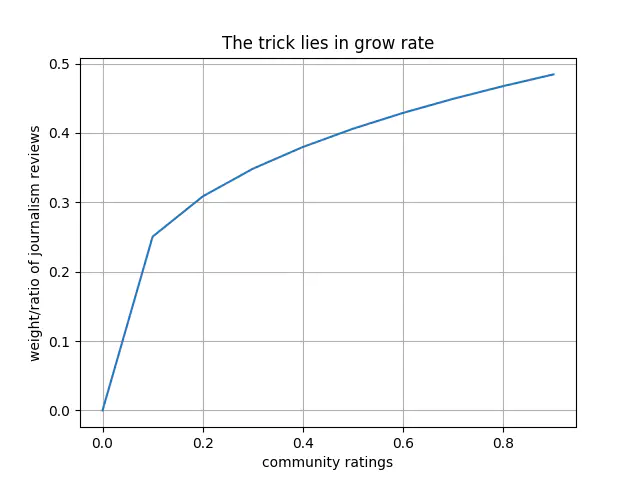
You have already seen it. It is displayed as a figure at the beginning of page. I shall give you the function of it in a moment. First, We assume community ratings are mostly based on gameplay and how far they enjoyed the game, and assume journalism ratings are mostly based on technical specification like graphics fidelity. We construct a weighted map, i.e function, of both ratings as:
$$repRat = (jw \times jr) + (cw \times cr)$$
where $jr$ and $cr$ represent ratings given by journalism and community, respectively. How do we define weights of both journalism and community ratings, namely, $jw$ and $cw$? Recall that we wish to achieve the idea illustrated in the previous paragraph, that is, weighting gameplay more than technical specifications. You might think of constant weights such as $0.75$ and $0.25$ but I do not think a linear model shall best-fit our desired representative-rating. Rather, I think an exponential grow rate is better. we define weight of journalism ratings as a map of community ratings. as:
$$jw = \frac{cr^{0.3}}{2}$$
We define weight of community ratings as:
$$1 - tw$$
The core of the trick here is that the lower a community rating is, which we assumed to represent gameplay experience, the the greater the rate of decrease becomes, as illustrated by the graph above. So, the lower the gameplay experience is, the less influence technical-specifications have.
Am I Sure of My Math?
NO!! What I have covered so far is at best a naive approximation based on domain-knowledge expertise. The assumptions about community and journalism ratings are not accurate enough. Also, The curve is not verified to fit some objective data. Conclusions made here are based on subjective intuition rather than rigor and accurate statistical analysis. However, the intuition here is slightly enhanced by extremely primitive mathematical toolbox and basic experience with gaming industry. It is our hope to devise a more rigor analysis motivated by one illustrated here.